


Market Valuation Charts: 10/08


Chart: 10-year trailing Graham ("Real") P/E Ratio. Price of the S&P 500 divided by the 10-year average of earnings, inflation adjusted. Current value (10/31/08): 15.9x
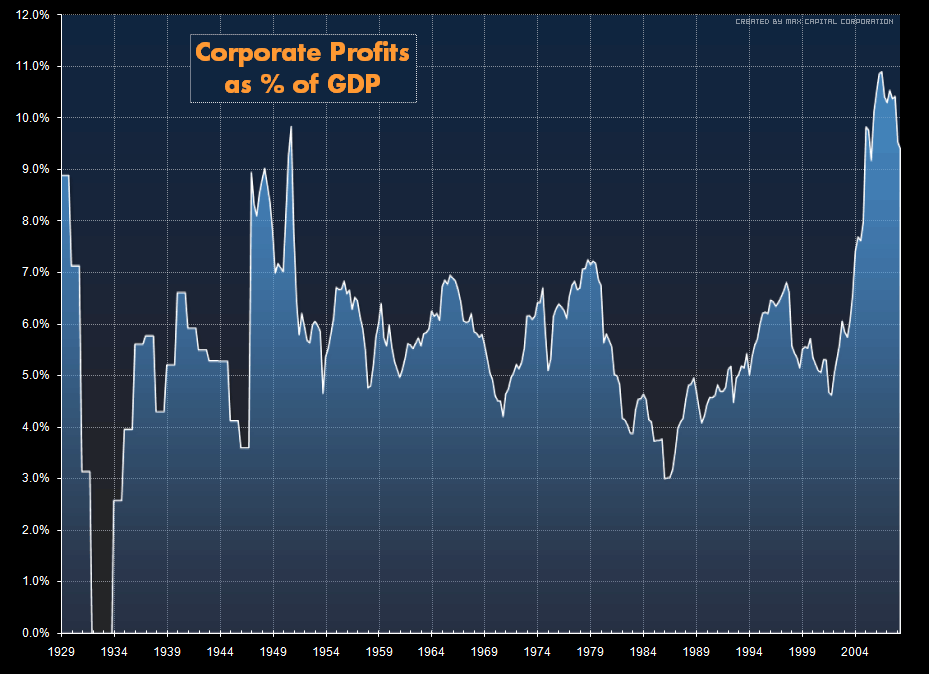
Chart: Profit Margin of U.S. Economy. Annualized corporate profits as a percentage of GDP. (A good reason why the Graham P/E Ratio is a better valuation measure than the TTM version.) Current value (6/30/08): 9.40%

Chart: Bond Yield over Equity Yield. 10-year treasury yield minus inverse of Graham P/E Ratio (10-year average equity earnings yield). Current value (10/31/08): -2.4% (equities yield 2.4% more than bonds)